






















OPHTHALMOLOGY
quantusRT-OCT: AI for retinopathy markers on OCT
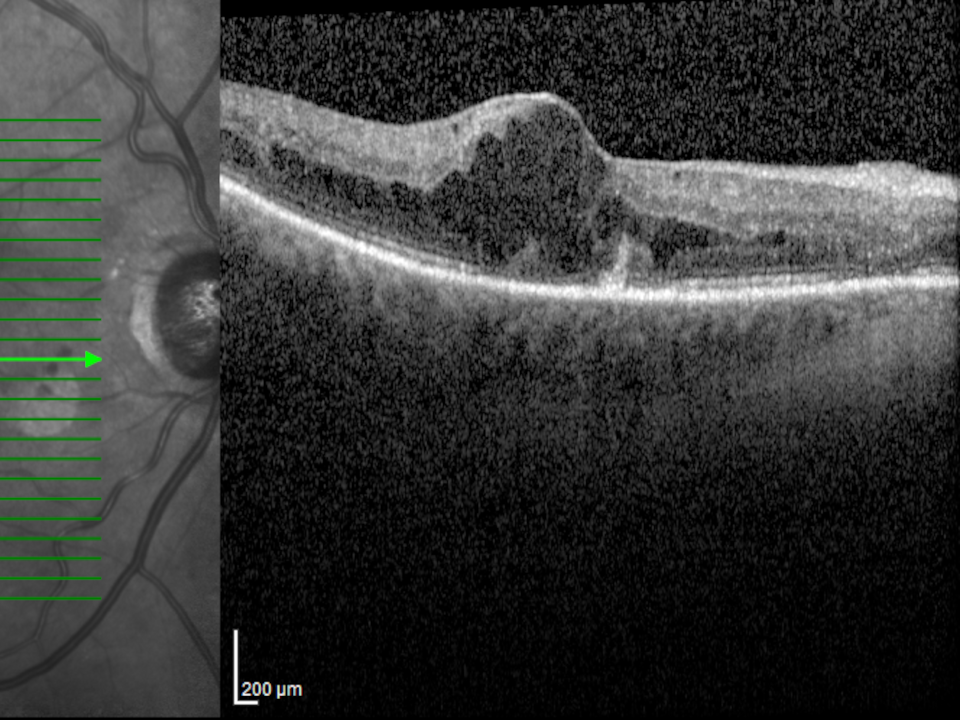
quantusRT-OCT uses Artificial Intelligence to identify microcysts and hyperreflective foci and quantify them quickly and objectively.

DESCRIPTION
quantusRT-OCT is a test for the detection of microcysts and hyperreflective foci based on the automatic analysis of an optical coherence tomography (OCT) image.
Our quantusRT-OCT software medical device (MDSW) is designed to help classify and prioritize patients with suspected diabetic retinopathy. Using artificial intelligence, it analyzes each OCT slice and reports the number of slices predicted as positive for microcysts and hyperreflective spots (HRS).
The generated report is designed to be used as a diagnostic support tool; its results should not replace a complete clinical evaluation performed by a specialist physician.
USE CASES

CU-RT-OCT-01: Prioritization of cases for ophthalmological review
When faced with a high volume of OCTs pending review, quantusRT-OCT automatically analyzes each image and provides a prediction of the presence of microcysts and hyperreflective foci, allowing the ophthalmologist to prioritize the case list and review those with the highest risk first.
CU-RT-OCT-02: Follow-up of patients with diabetic retinopathy
In each follow-up OCT study, quantusRT-OCT analyzes the retinal slices and indicates how many show the presence of microcysts or hyperreflective foci, allowing comparison with the patient’s previous studies as part of periodic follow-up, providing an objective, comparable measure across successive visits.

CLINICAL EVIDENCE
Tool for the detection of microcysts and hyperreflective foci based on the automatic analysis of optical coherence tomography (OCT) images
The aim of this study was to create a new tool based on Deep Learning techniques to automatically detect microcysts and hyperreflective foci in OCT images. The study used 5,194 images from 129 studies, from Río Hortega University Hospital and Puerta de Hierro University Hospital. 70% of the studies were used to develop two independent binary classifiers, designed to automatically detect microcysts and hyperreflective foci respectively, while the remaining 30% was used to evaluate both models.
The results for the two classification models are:
| Sensitivity | Specificity | PPV * | NPV * | |
|---|---|---|---|---|
| Microcysts | 87.3% | 94.4% | 91.2% | 91.8% |
| Hyperreflective foci | 82.8% | 85.6% | 85.6% | 82.8% |
* PPV and NPV (Positive Predictive Value and Negative Predictive Value)

CLINICAL VALIDATION
Validation of the tool using an independent database
To evaluate the correct performance of the algorithm against real-world data, an independent database was used consisting of 1,411 OCT B-scan images, obtained prospectively from 48 eyes of 28 patients.
The following results were obtained during validation:
| Sensitivity | Specificity | PPV * | NPV * | |
|---|---|---|---|---|
| Microcysts | 91.0% | 97.7% | 93.5% | 96.7% |
| Hyperreflective foci | 98.5% | 90.0% | 79.1% | 99.4% |
* PPV and NPV (Positive Predictive Value and Negative Predictive Value)

SOLUTION INTEGRATION
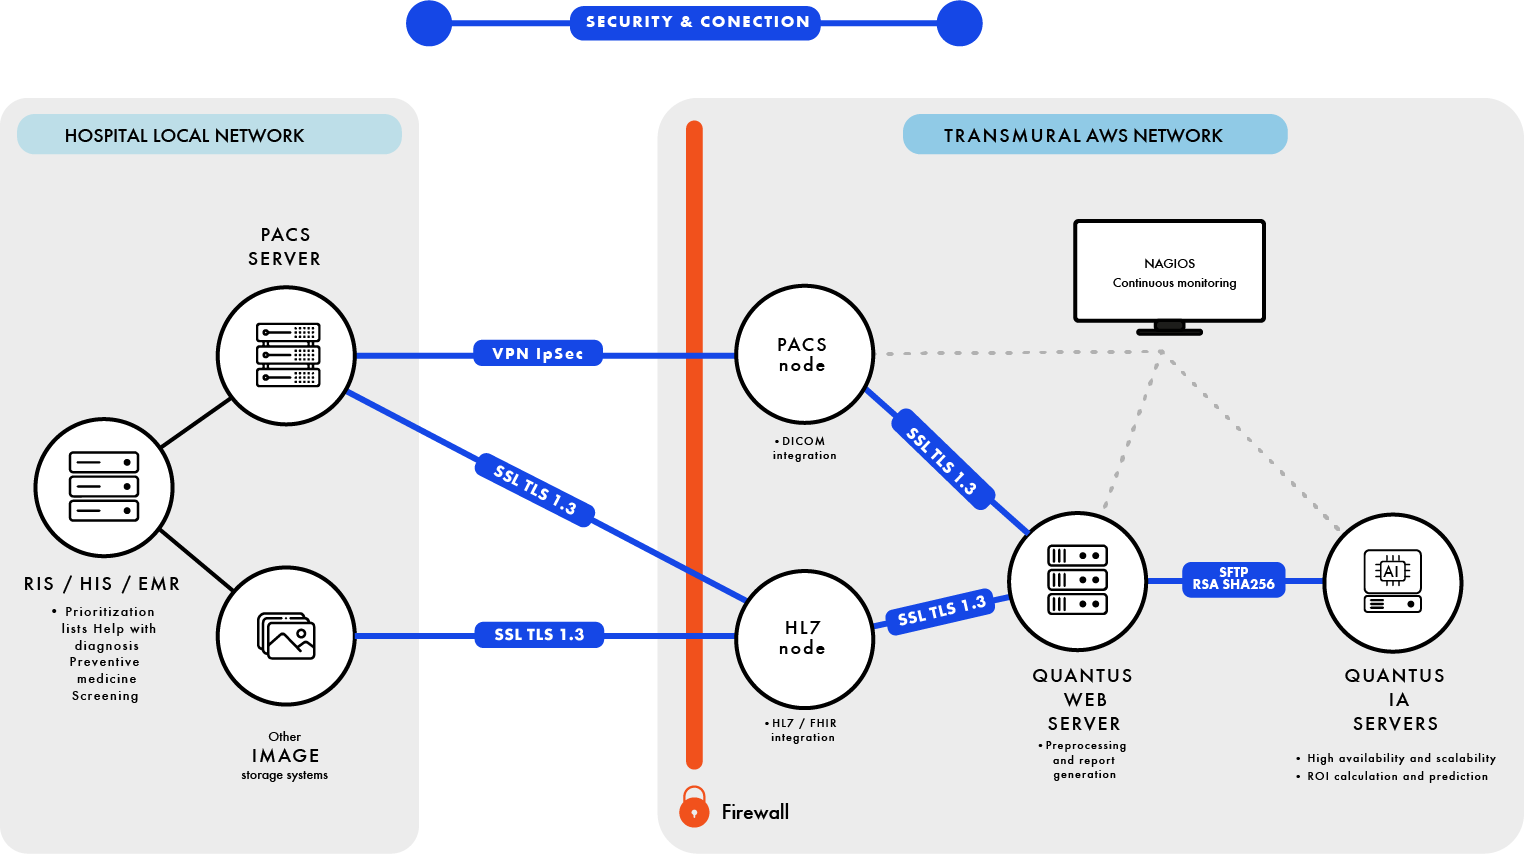
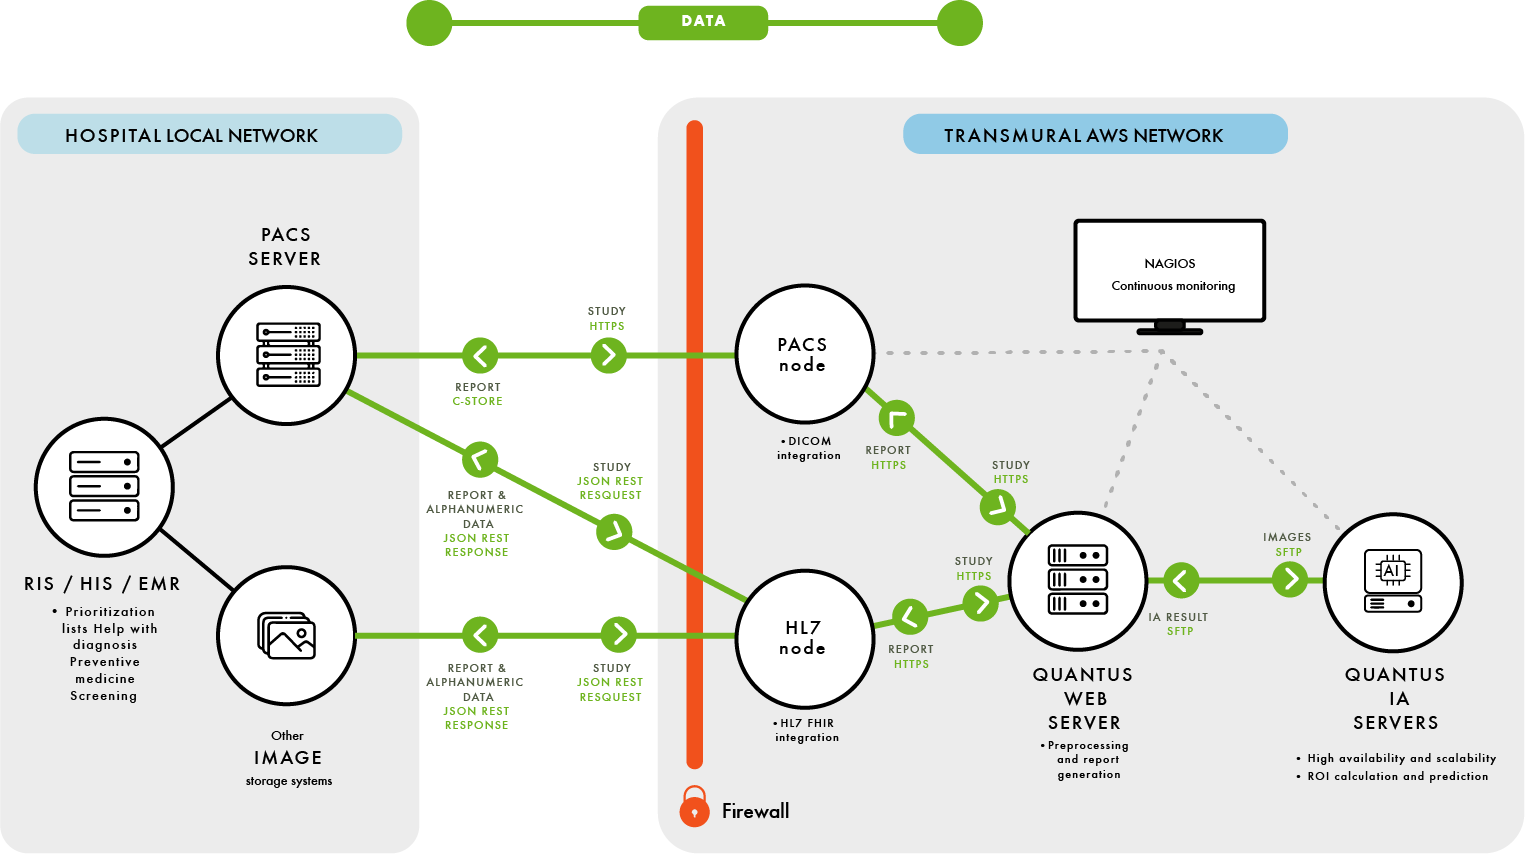
- Our products allow integration with client systems through the DICOM protocol and the HL7 FHIR interface
- We ensure data privacy in SaaS installations by establishing IPsec VPNs with our clients.
- All communications outside the client environment are secured with SSL TLS 1.3

LICENSING BY NUMBER OF TESTS
LICENSING BY ANALYSES PERFORMED
CUSTOM OFFERS


